ActiveReports: The Industry-Leading Reporting Solution for .NET and JavaScript Developers
MESCIUS' ActiveReports line of products is a complete developer reporting solution for both .NET and JavaScript. Deliver interactive reports with our intuitive and user-friendly designers and rich controls.
Download Free Trial
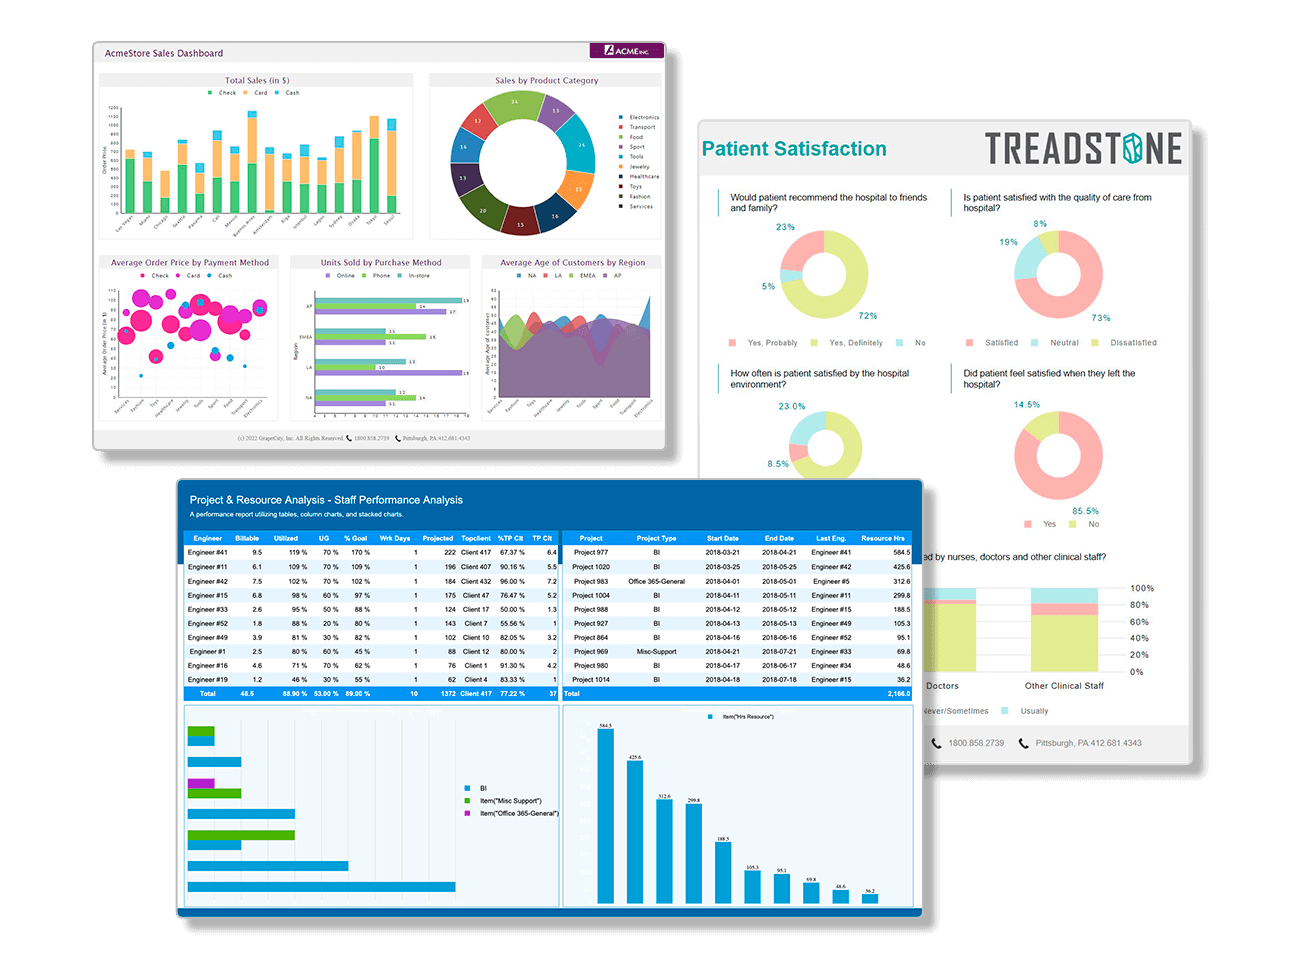
Deliver Powerful Reports With Our Intuitive and User-Friendly Report Designers and Controls
MESCIUS' ActiveReports reporting solutions provide a familiar and flexible developer reporting tool and experience.
Customize reporting and styling to your needs, Create interactive reports with our .NET and JavaScript report designers that include drag and drop support.
Deliver reusable reports directly to your end users. They can use our interactive report viewers, export, or print directly on the client.
ActiveReports.NET
ActiveReports is a premium enterprise-level .NET reporting solution for web and desktop applications.
Deliver rich interactive reports with our feature-packed reporting solution for all platforms.
- Build reports that utilize cross-platform reporting with .NET Core
- Create interactive end-user report designers for web and desktop applications
- Customize unique report types to fit your .NET reporting needs on the platform of your choice
ActiveReportsJS
ActiveReportsJS is a reporting solution for visualizing data in web-based JavaScript applications.
Includes standalone multi-platform design application with a rich set of controls.
Expert Support Is Included
The Support You Need When You Need It
Direct access to engineers who will work with you to resolve any issue
Be part of thousands of users in our monitored forums
24-hour response time in our ticketing system
Customer satisfaction rating is 85% and climbing
Featured Blogs and Videos

Trusted by the World's Leading Companies
